The Doomsday Glacier
#Interactive Storytelling #Visual Journalism #Exhibition Design #Web App #Playful Communications for Serious Research

The Doomsday Glacier is a web-based interactive visual journalism piece that delves into the story of the Thwaites Glacier in Antarctica. It combines a historical timeline of the glacier's fracturing with an in-depth exploration of its anatomy and the global consequences of its melting. Designed to educate and inspire action, the experience translates complex scientific data into an accessible and compelling narrative.
Through dynamic interactive storytelling, The Doomsday Glacier bridges the gap between climate science and public understanding. By transforming abstract concepts into engaging visuals and narratives, it fosters a deeper connection to the urgent realities of climate change, empowering audiences to grasp the impact of glacier melting on our planet.
The piece was selected by the *This Is Not A Drill* program and was exhibited at the NYU Elmer Holmes Bobst Library from September to December in 2023.
Timeline
Link to Project
Tools
Media Coverage
- 1st Iteration: June - August 2023
- 2nd Iteration: October 2024 - January 2025
Link to Project
Tools
- Frontend Development: React, GSAP, react-scrollama
- Data Visualization: D3.js
- 3D Animation: Blender
Media Coverage
Project Partner
My Role:
-
Briana Jones (Initial Reseach in 2023)
- Yi-Chun Lan (3D Modeling)
My Role:
- Ideation & Research: Initiated the project concept and conducted thorough research on the Thwaites Glacier's significance
- Data Collection & Visualization: Gathered data on glacier dynamics and developed visualizations to present information on glacier fracturing timeline and its consequences
- Web Development: Built the interactive web application, integrating storytelling elements to guide users through the glacier’s historical timeline
✶ Project Highlight
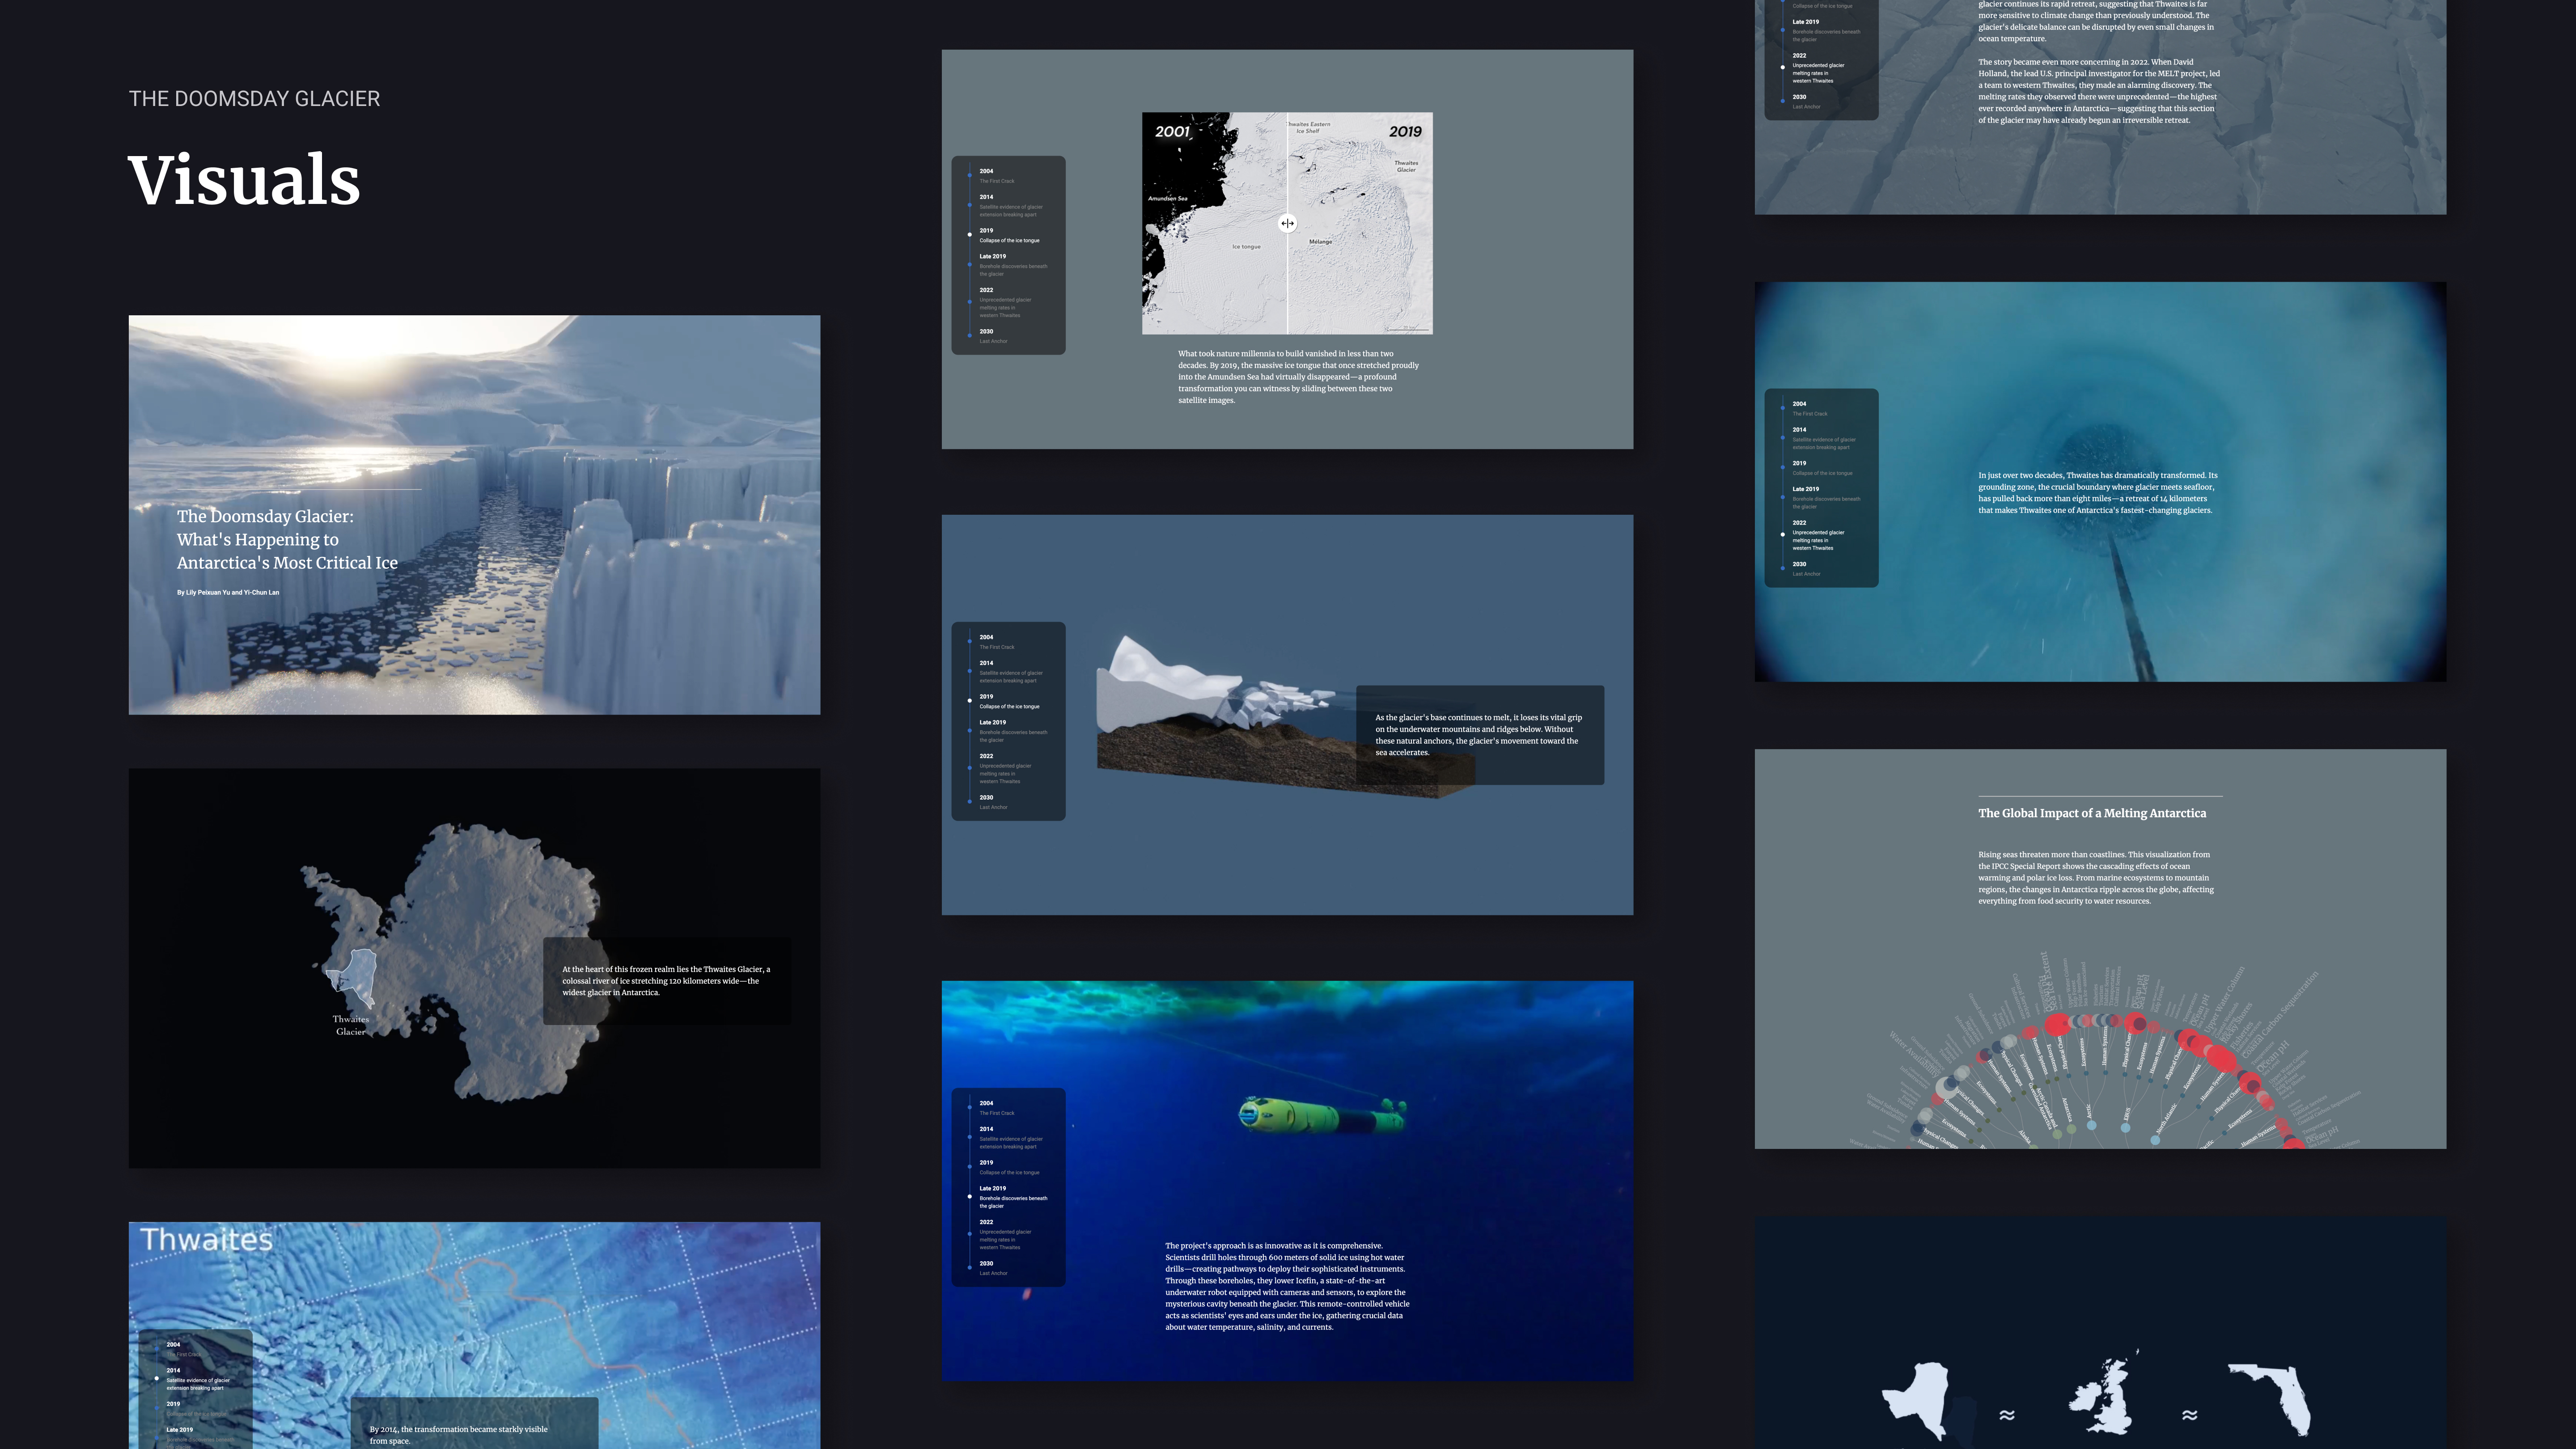
a. Visual Storytelling
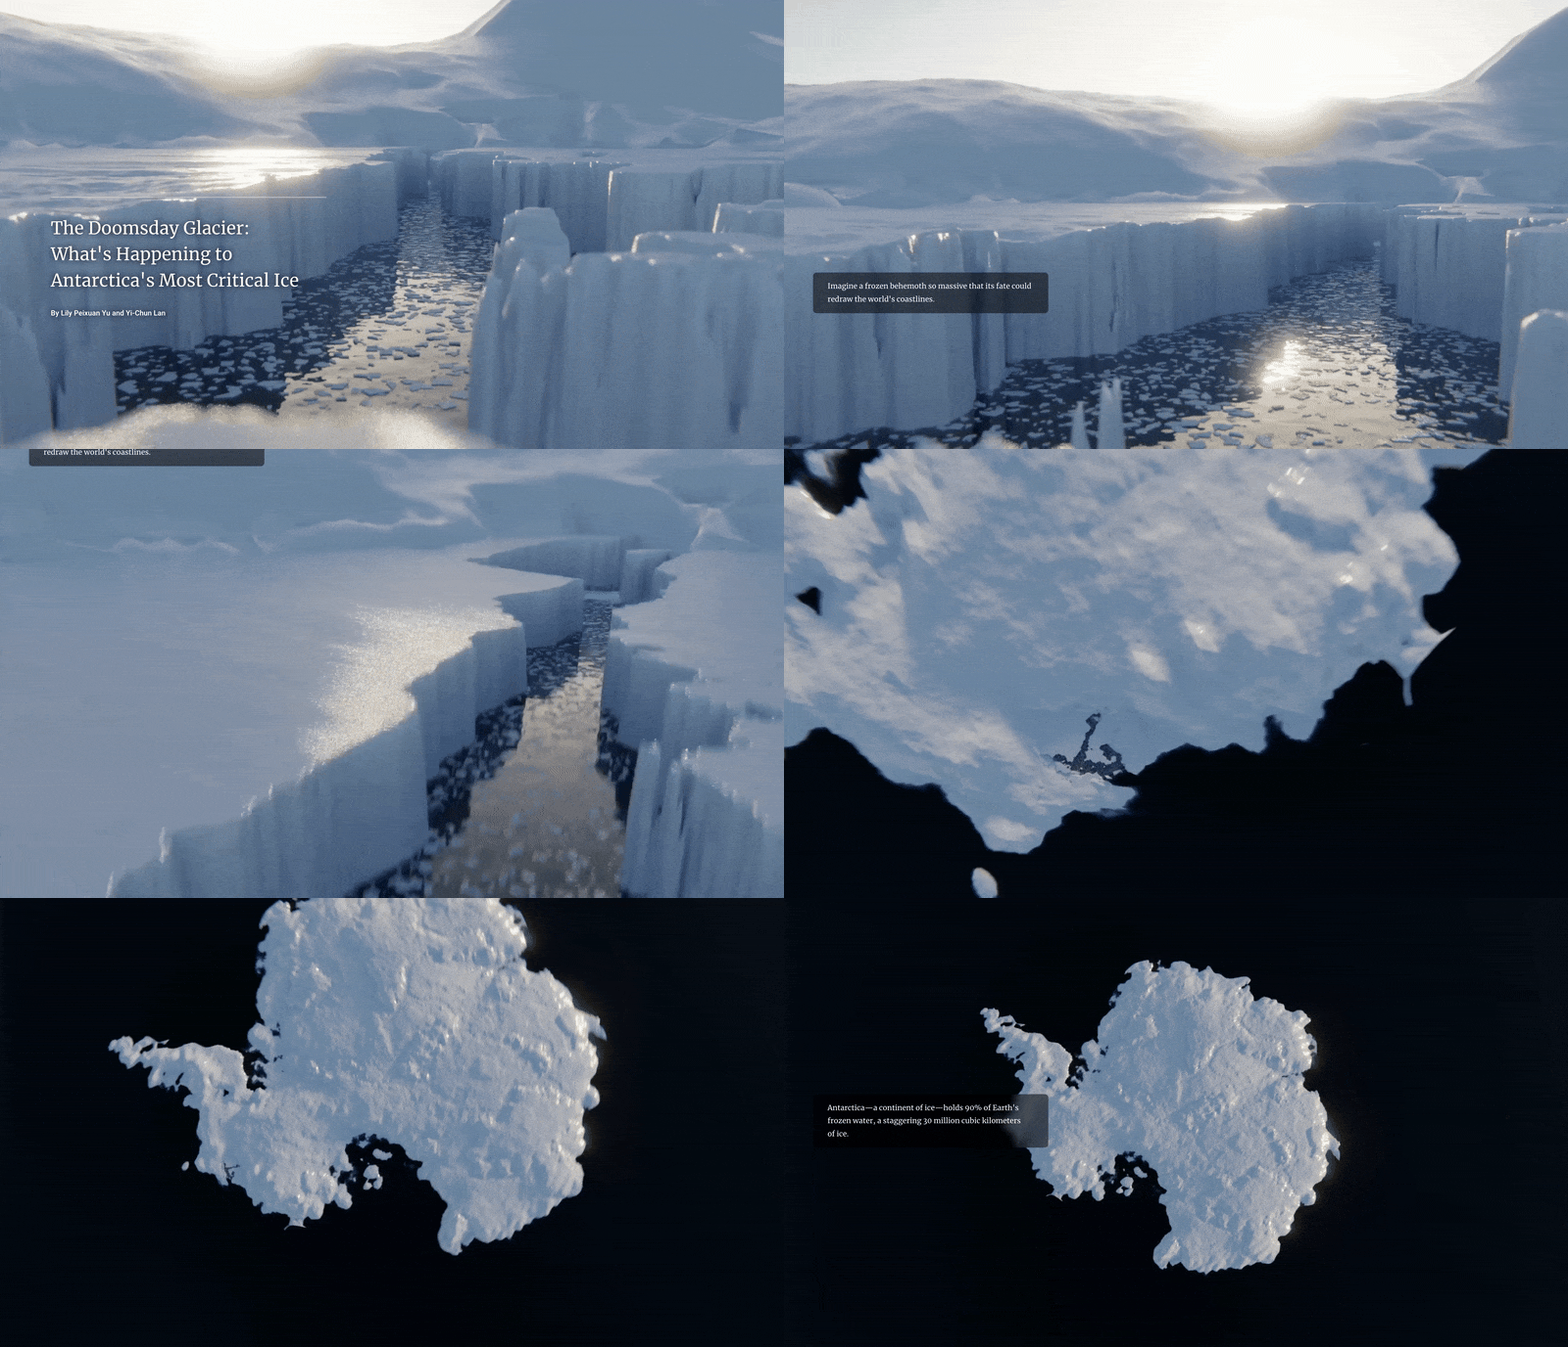
3D Animation:
Fracturing of The Thwaites Glacier
![]()
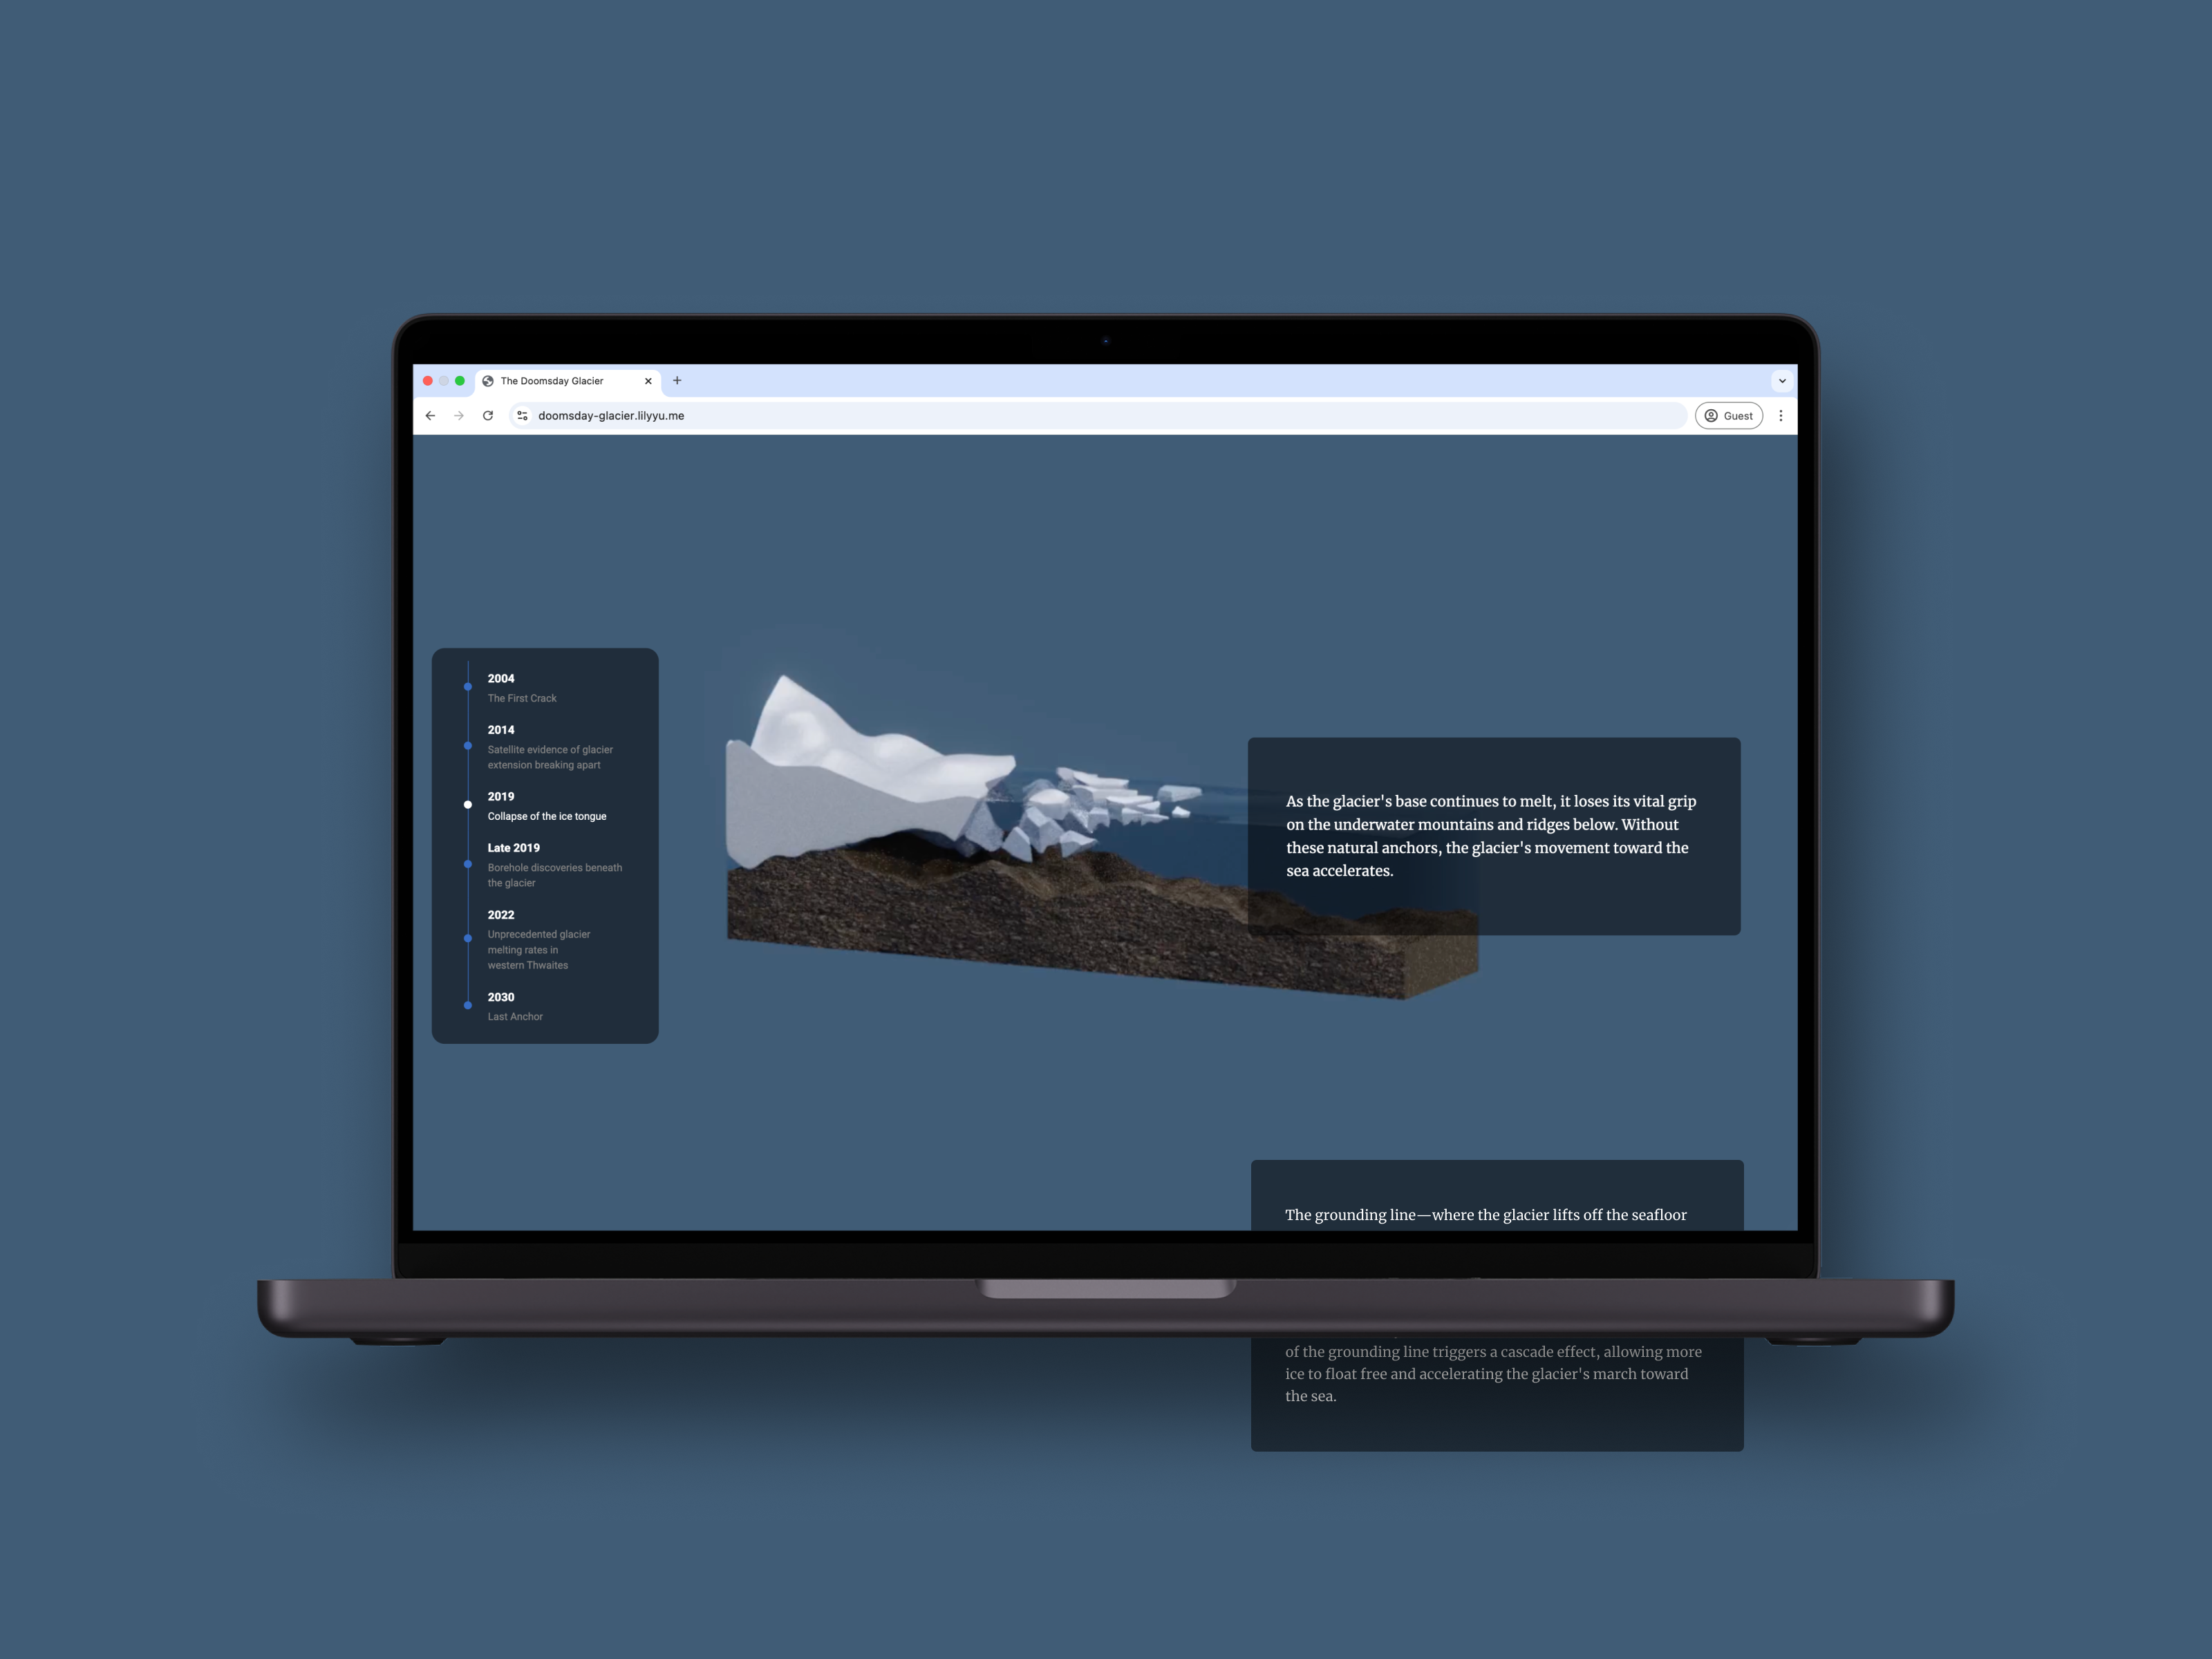
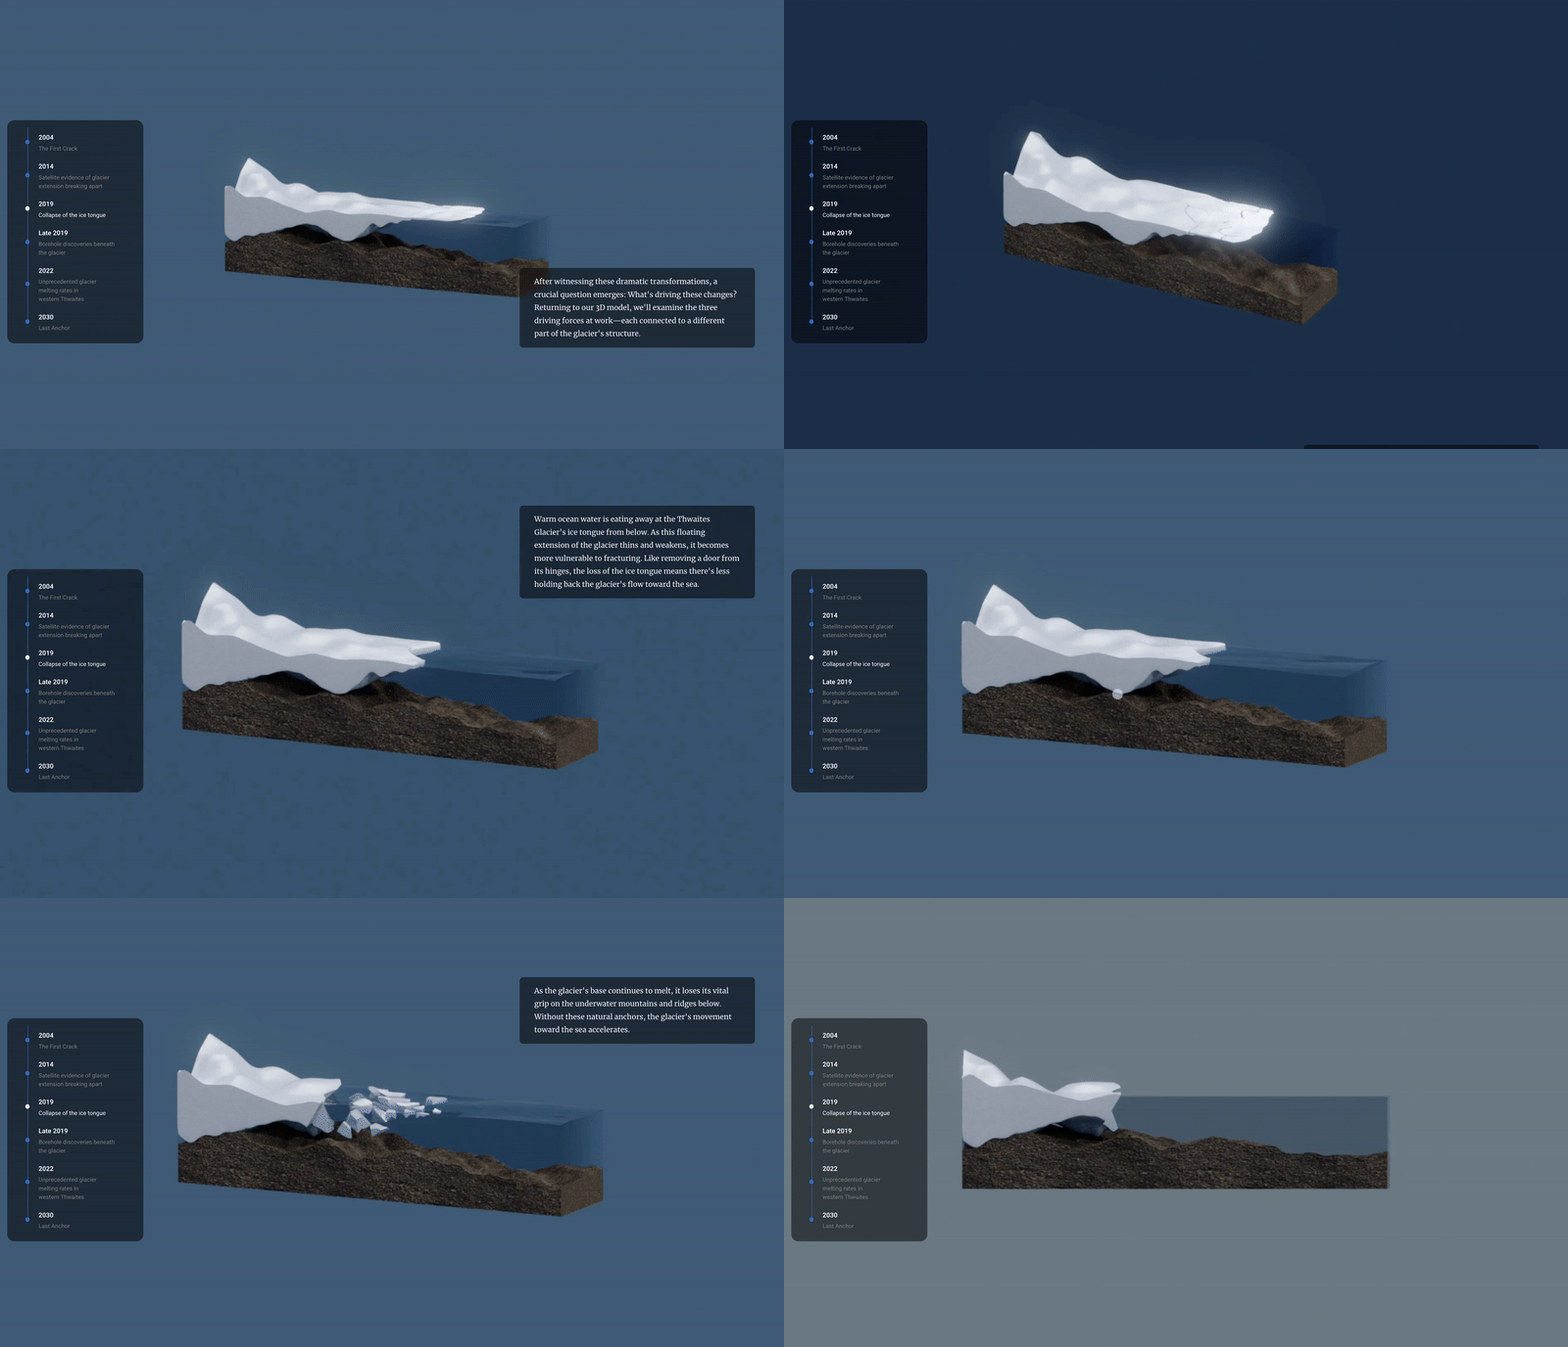
Visual Explainer:
Structural Anatomy of The Glacier
![]()
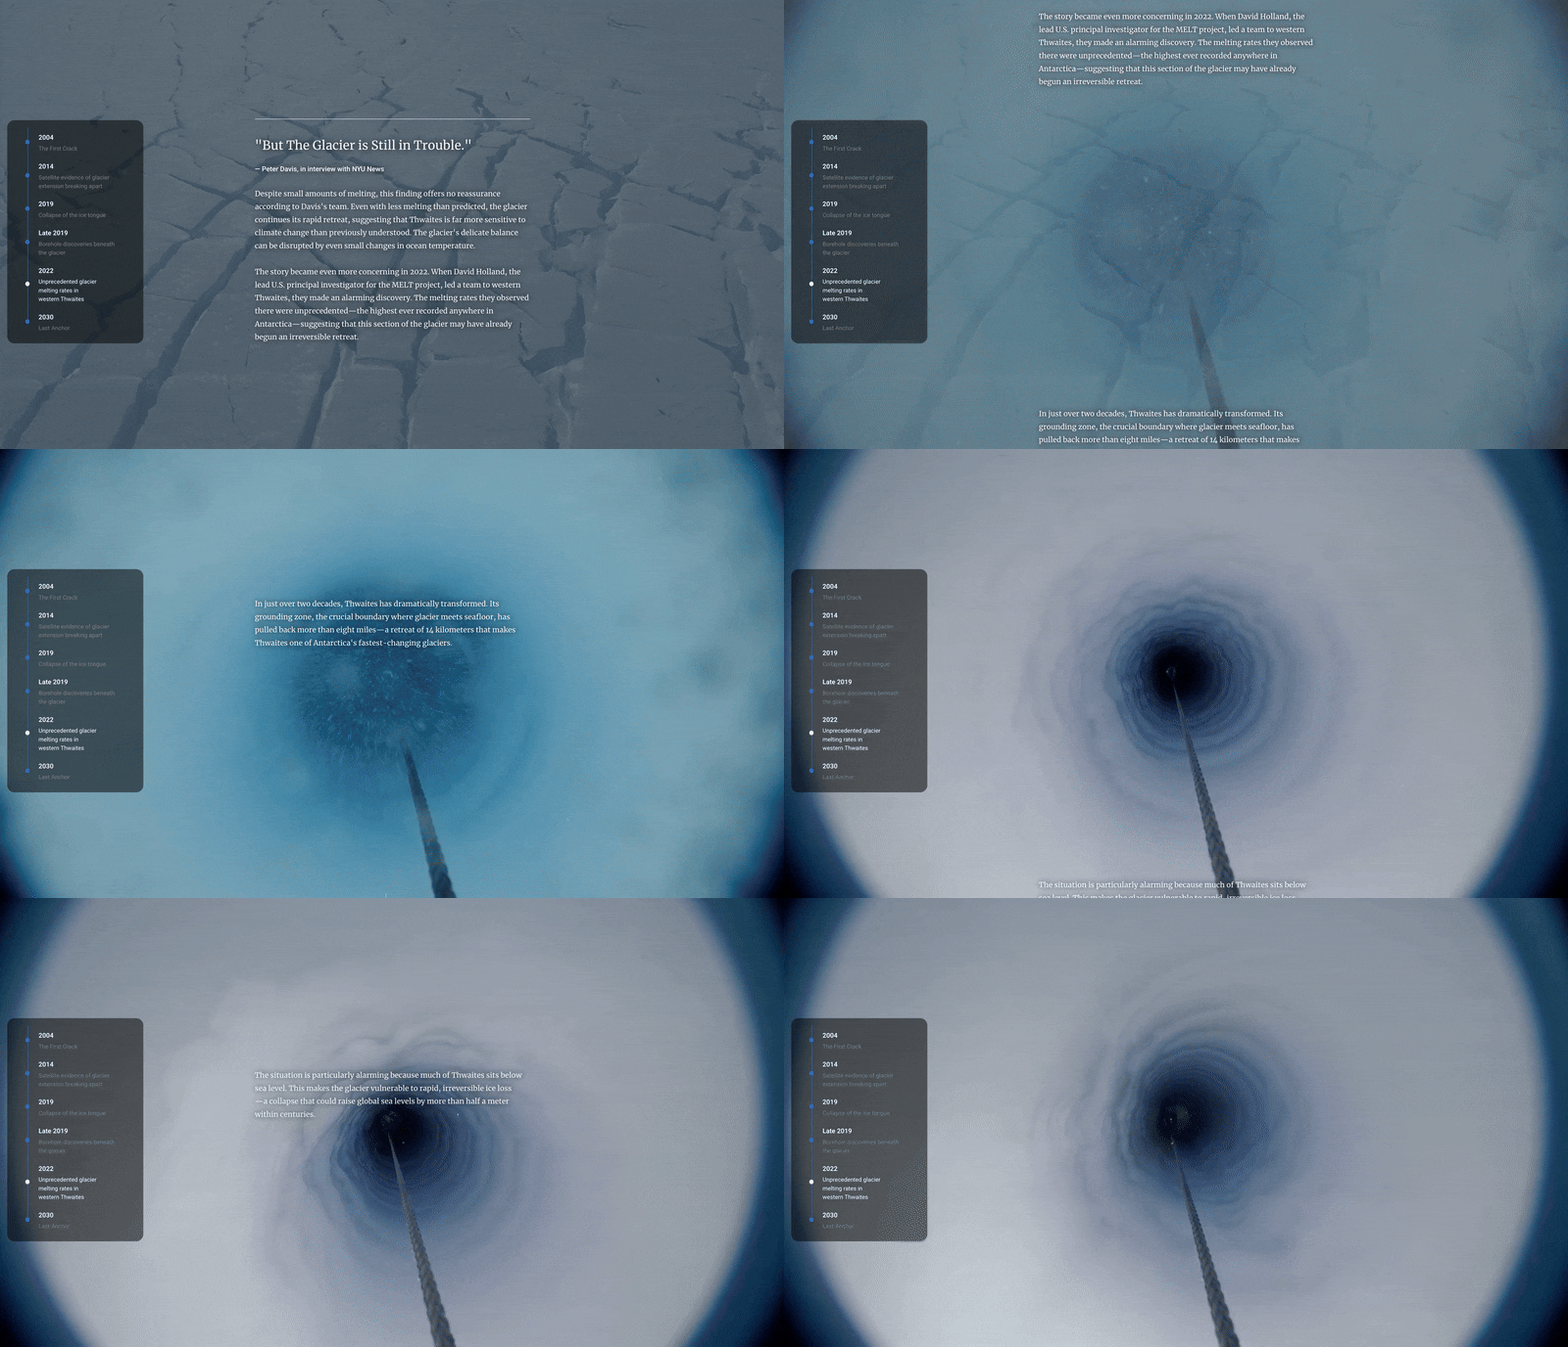
Scrollytelling:
Underwater Research for Melting Rate Measurement
![]()
Fracturing of The Thwaites Glacier
Visual Explainer:
Structural Anatomy of The Glacier
Scrollytelling:
Underwater Research for Melting Rate Measurement
b. Interactive Components
Comparison Slider:
Thwaites Glacier’s Ice Tongue, 2001 vs. 2019
(Slide to interact)
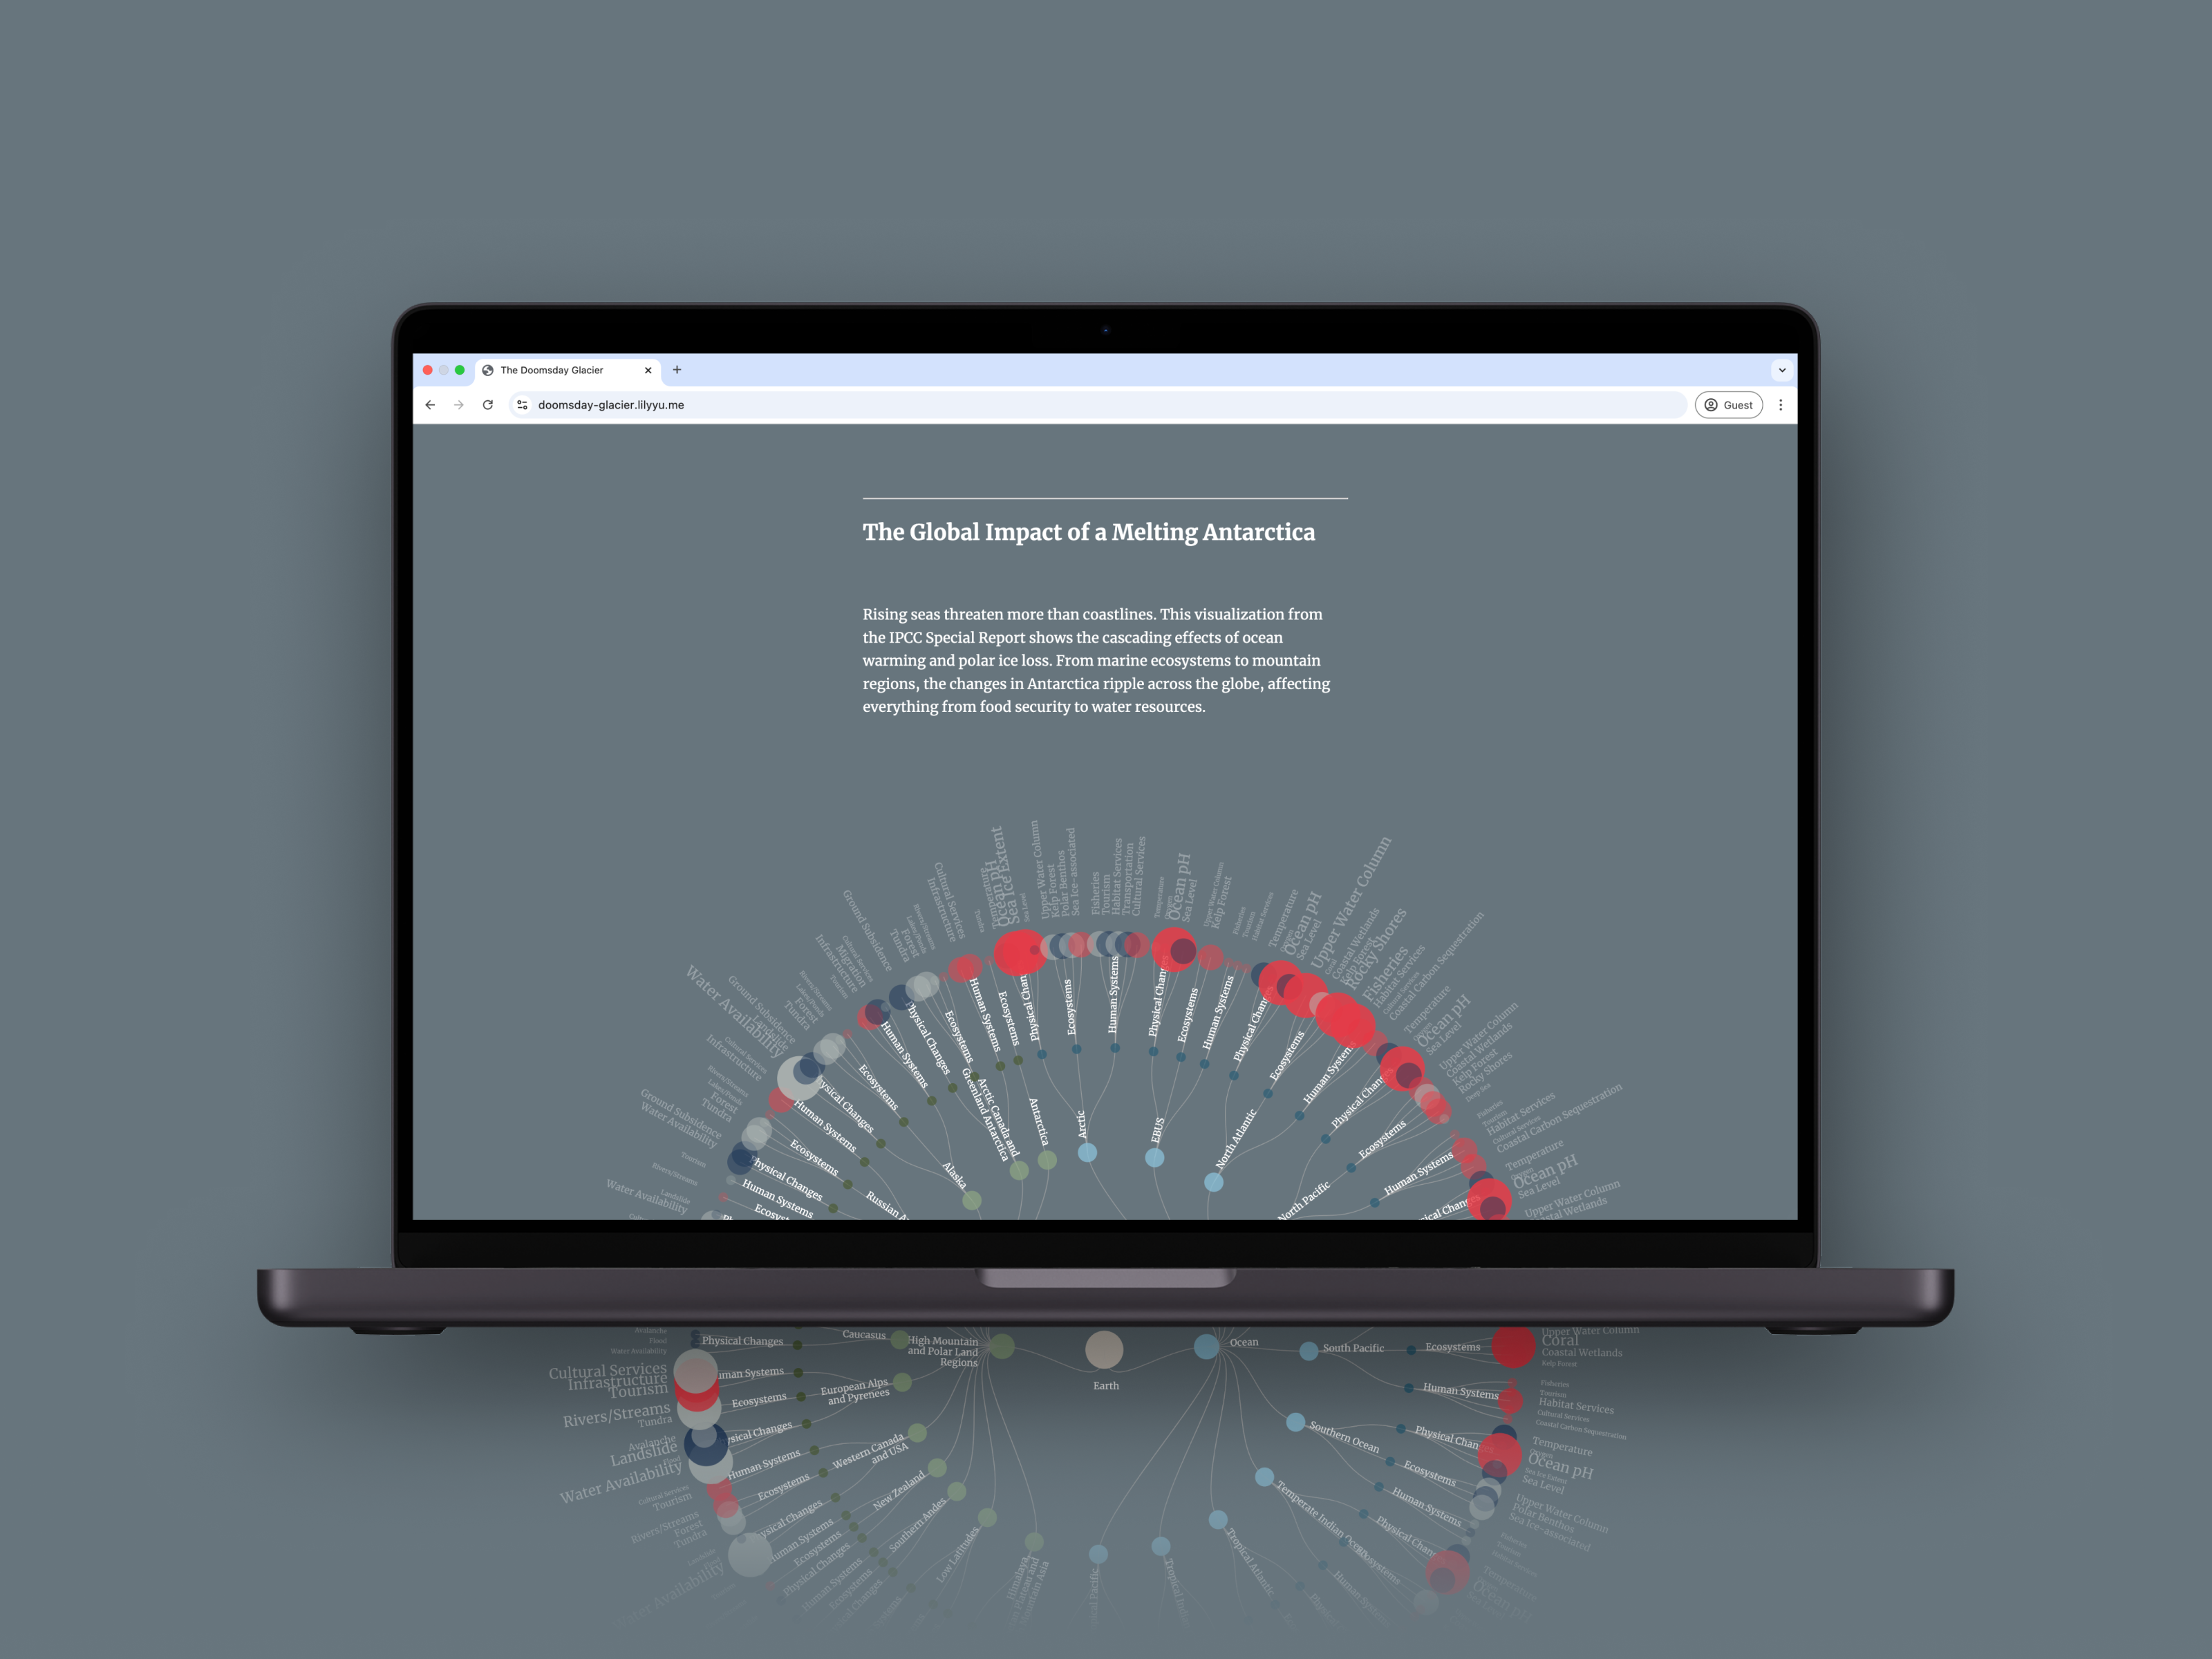
Data Visualization:
Regional Hazards and Impacts by Ocean and Cryospheric Changes
(Hover to interact)
Thwaites Glacier’s Ice Tongue, 2001 vs. 2019
(Slide to interact)
Data Visualization:
Regional Hazards and Impacts by Ocean and Cryospheric Changes
(Hover to interact)

00. *This Is Not A Drill* Open Call

“The *This Is Not A Drill* program on technology, the climate emergency, equity, and creative practice collaboratively develops such a public pedagogy. It is led by Director and inaugural FIC Fellow Mona Sloane and explores what Arturo Escobar has called “designs for the pluriverse”: designs that account for the pluralities of being, that dismantle the harmful hierarchies that were created between human/non-human and culture/nature, and that reorient us towards sustainment, maintenance and care for each other and for the planet.”
01. Ideation & Research
a. Inspirations
M
Motivated by the open call, Briana and I aimed to leverage creative technology for climate emergency awareness. Our exploration led us to this article detailing recent findings on the melting beneath the Thwaites Glacier. Delving into the published research, we were struck by the glacier's critical role in global sea level rise. This prompted us to center our project on Thwaites Glacier, recognizing its profound implications for coastal communities and ecosystems worldwide.
![Research on the melting of the Thwaites Glacier]()
b. Significance of The Thwaites Glacier
T
The Thwaites Glacier, often referred to as the “Doomsday Glacier,” is among the largest and most rapidly melting glaciers in
Antarctica. Its accelerated melting poses a significant threat, with the potential to drastically raise sea levels, thereby endangering coastal communities and ecosystems worldwide. Understanding the changes occurring in this glacier is crucial for assessing global sea level rise and preparing for its impacts.
.
![Cracks in Thwaites Glacier, 2020]()
c. Research and ConceptualizationT
To enrich our understanding, we reached out to Dr. Peter Davis from the British Antarctic Survey. Dr. Davis, involved in ocean measurements for calculating the glacier's melting rate, provided invaluable insights into the glacier's structure and the research methodology. Through a series of emails and virtual meetings, he directed us to relevant reports by the Intergovernmental Panel on Climate Change (IPCC), enhancing our comprehension of the broader consequences of the glacier's melting.
M
Motivated by the open call, Briana and I aimed to leverage creative technology for climate emergency awareness. Our exploration led us to this article detailing recent findings on the melting beneath the Thwaites Glacier. Delving into the published research, we were struck by the glacier's critical role in global sea level rise. This prompted us to center our project on Thwaites Glacier, recognizing its profound implications for coastal communities and ecosystems worldwide.

b. Significance of The Thwaites Glacier
T
The Thwaites Glacier, often referred to as the “Doomsday Glacier,” is among the largest and most rapidly melting glaciers in
Antarctica. Its accelerated melting poses a significant threat, with the potential to drastically raise sea levels, thereby endangering coastal communities and ecosystems worldwide. Understanding the changes occurring in this glacier is crucial for assessing global sea level rise and preparing for its impacts.
.

To enrich our understanding, we reached out to Dr. Peter Davis from the British Antarctic Survey. Dr. Davis, involved in ocean measurements for calculating the glacier's melting rate, provided invaluable insights into the glacier's structure and the research methodology. Through a series of emails and virtual meetings, he directed us to relevant reports by the Intergovernmental Panel on Climate Change (IPCC), enhancing our comprehension of the broader consequences of the glacier's melting.
02. Project Goals
a. Educational Focus
W
With comprehensive research, our focus crystallized on educating the audience about:
![]()
Detailing the chronological events leading to the fracturing of Thwaites Glacier.
![]()
Illustrating the wide-ranging impacts of the glacier’s melting on global sea levels and the resulting threats to coastal regions.
![]()
Providing an in-depth look at the anatomy of Thwaites Glacier.
![]()
Exploring the primary factors contributing to the glacier’s rapid decline.
b. Project Scope
![System Diagram]()
W
With comprehensive research, our focus crystallized on educating the audience about:

Detailing the chronological events leading to the fracturing of Thwaites Glacier.

Illustrating the wide-ranging impacts of the glacier’s melting on global sea levels and the resulting threats to coastal regions.

Providing an in-depth look at the anatomy of Thwaites Glacier.

Exploring the primary factors contributing to the glacier’s rapid decline.
b. Project Scope
Interactive Storytelling Experience
We developed a web-based interactive storytelling platform that guides users through the timeline of the Thwaites Glacier's fracturing. This experience visually portrays the significant consequences of its melting, offering an immersive educational journey.3D Interactive Application
Complementing the storytelling experience, we created an interactive application featuring 3D models of the glacier. This application employs animations to illustrate the glacier’s anatomy and explains the key factors driving its melting, providing a comprehensive understanding of the underlying dynamics.
03. Design & Development
In the following section, I will focus on the screen-based experience development process, which was my primary responsibility within the project.
a. Research Integration
![IPCC Report on Climate Change]() I gathered and synthesized data from expert consultations, scientific reports, and scholarly articles related to the Thwaites Glacier's melting patterns, fracturing timeline, and implications for sea level rise.
I gathered and synthesized data from expert consultations, scientific reports, and scholarly articles related to the Thwaites Glacier's melting patterns, fracturing timeline, and implications for sea level rise.
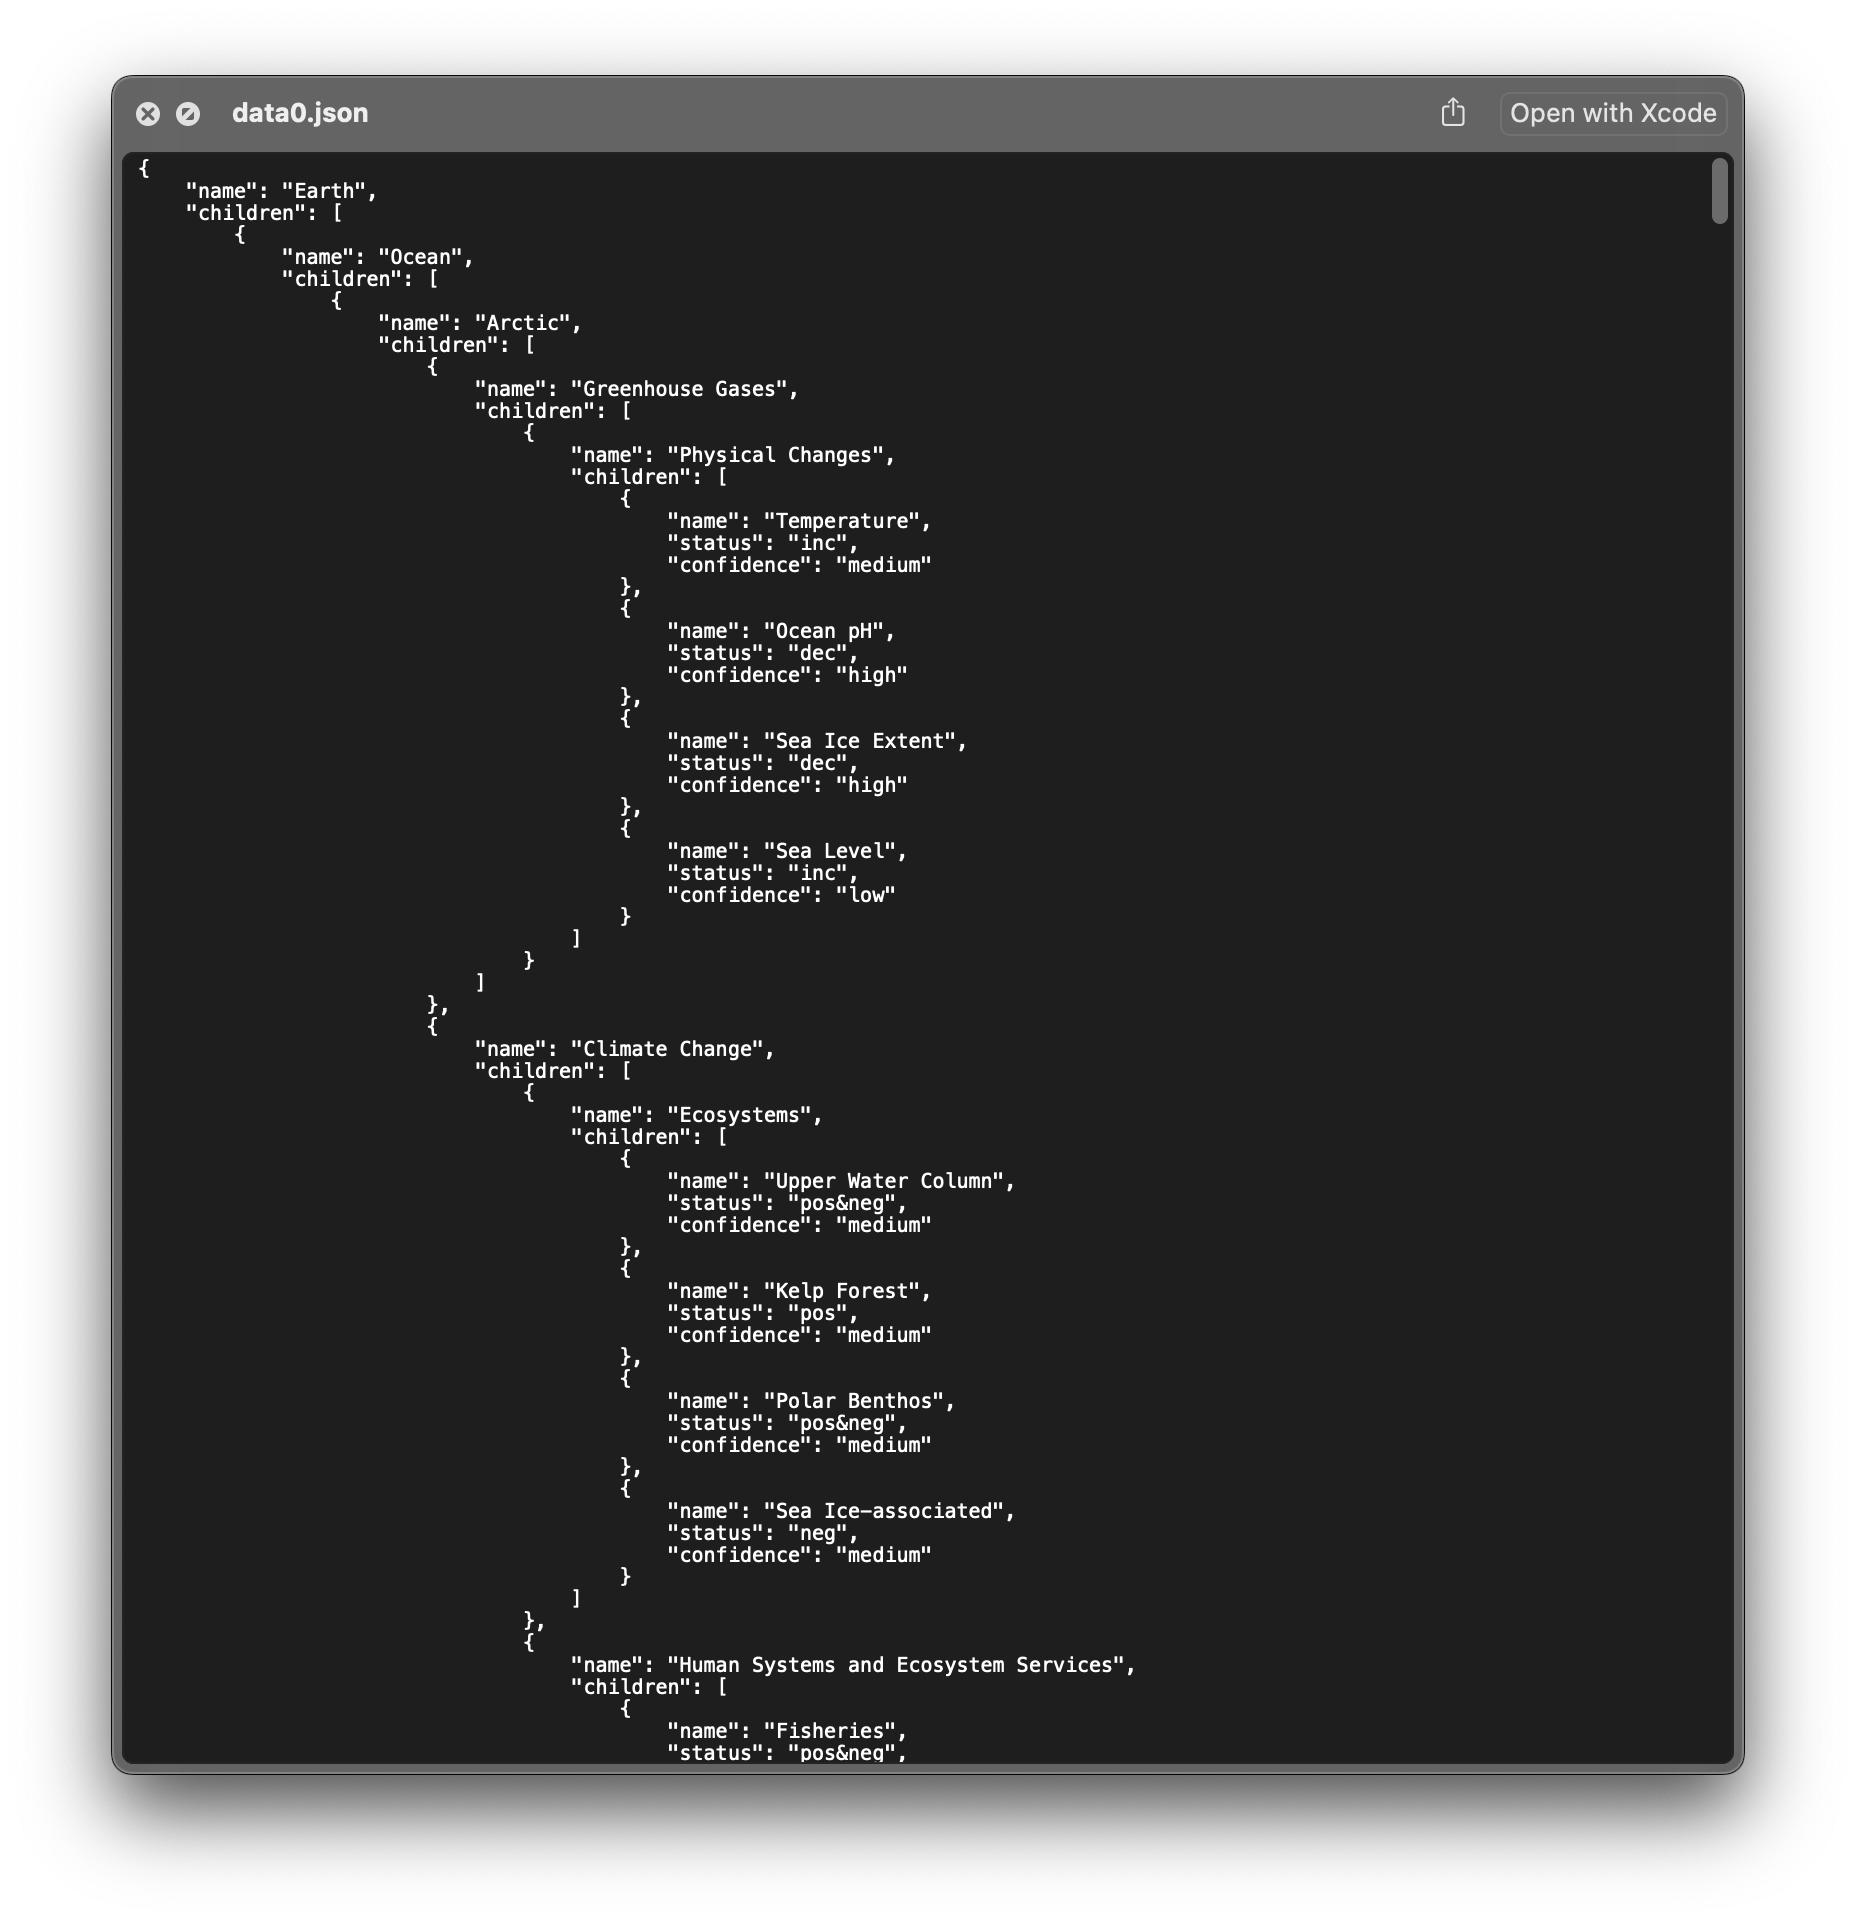
Based on the data from the scientific reports, I created a customized json data file for the data visualization part of the screen experience.
![Original Data Sheet from Report]()
![Extracted and Organized Data in json Format]()
a. Research Integration
Data Collection

Based on the data from the scientific reports, I created a customized json data file for the data visualization part of the screen experience.

Content Structuring
I organized the collected data into an educational narrative for the web application. This included:- Timeline of Fracturing
- Consequences Visualization
04. Final Work
05. Exhibition @NYU Library

